Most people think version control is a safety net.
It’s not. It’s a map.
A git graph is a visual record of decisions — when you changed direction, when you experimented, when you committed to a path. If you look at it properly, it doesn’t just show code history. It shows how you think.
The Hidden Story Inside a Repository
Every project has two versions.
The one people see at the end, and the one that actually happened.
The real version is messy: experiments, abandoned ideas, risky branches, last-minute fixes. A git graph lets you see that reality as a structure instead of a blur.
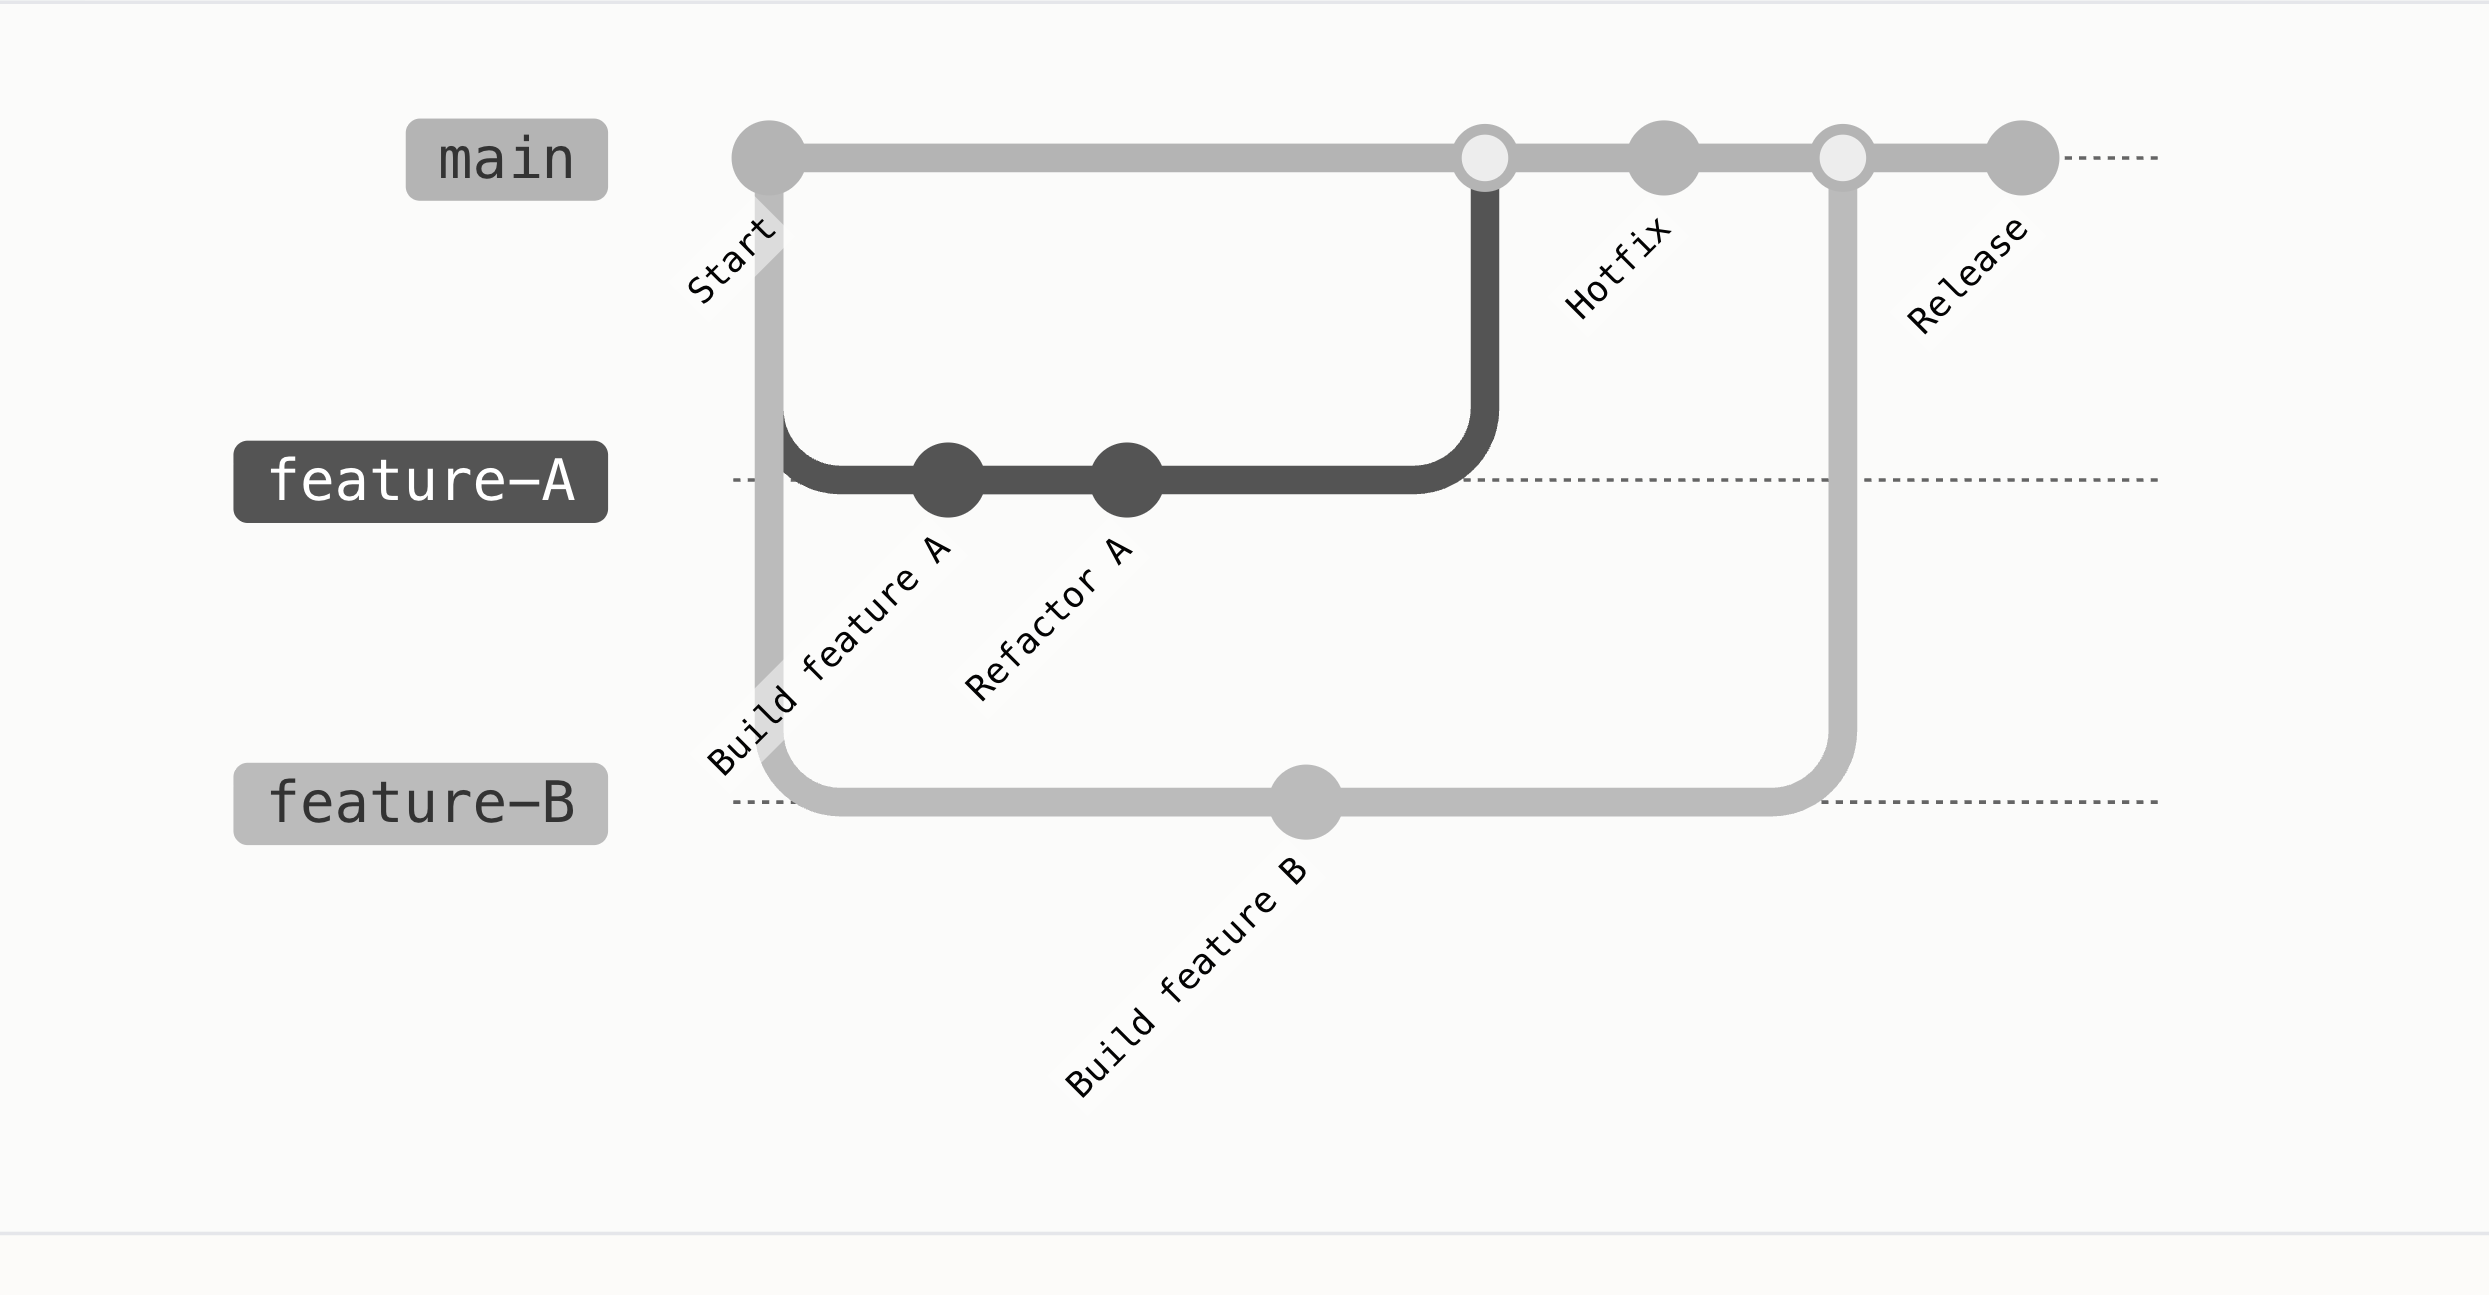
Here’s a simple test graph so you can see how the history actually looks when visualised.
Diagram: commit id: "Start"; branch feature A; checkout feature A; commit id: "Build feature A"; commit id: "Refactor A"; checkout main; branch feature B; checkout feature B; commit id: "Build feature B"; checkout main; merge feature A; commit id: "Hotfix"; merge feature B; commit id: "Release".
Diagram: commit id: "Start"; branch feature A; checkout feature A; commit id: "Build feature A"; commit id: "Refactor A"; checkout main; branch feature B; checkout feature B; commit id: "Build feature B"; checkout main; merge feature A; commit id: "Hotfix"; merge feature B; commit id: "Release".
Look at it closely and you’ll notice something: progress is not a straight line. It’s parallel lines that occasionally converge.
That’s what real work looks like.
How to Read a Git Graph Like a Strategist
Most people look at a git graph and see technical noise. But if you read it properly, it tells a story about risk and decision-making.
If your graph is one long straight line, it usually means one of two things: either the project is very small, or you are not experimenting enough.
A Simple Workflow Pattern
Here’s a clean mental model most small teams and solo builders use.
Main → Feature → Merge → Release
- ·Software teams
- ·Book writing with drafts
- ·Design iteration
- ·Product development
You are building anything that improves over time instead of appearing fully formed.
The Solo Builder Version
If you are working alone, your git graph becomes even more important because it replaces something you don’t have: a team memory.
Random changes, overwritten files, “which version was better?” moments.
Every experiment tracked, every decision visible, every version recoverable.
A Practical Rule
Should you create a new branch?
- ✓You are testing a new feature
- ✓You are changing structure
- ✓You are not sure it will work
- ✗You are fixing a typo
- ✗You are changing text
- ✗You are making a tiny safe change
If the change would hurt to lose or break things, branch first.
Final Thought
A git graph is not a technical diagram.
It’s a decision diagram.
And once you start seeing your work that way, you stop thinking in terms of files and start thinking in terms of moves.
If this resonates, see how to apply it to your own work with the interactive Dispatch agent.
Be first to like this dispatch